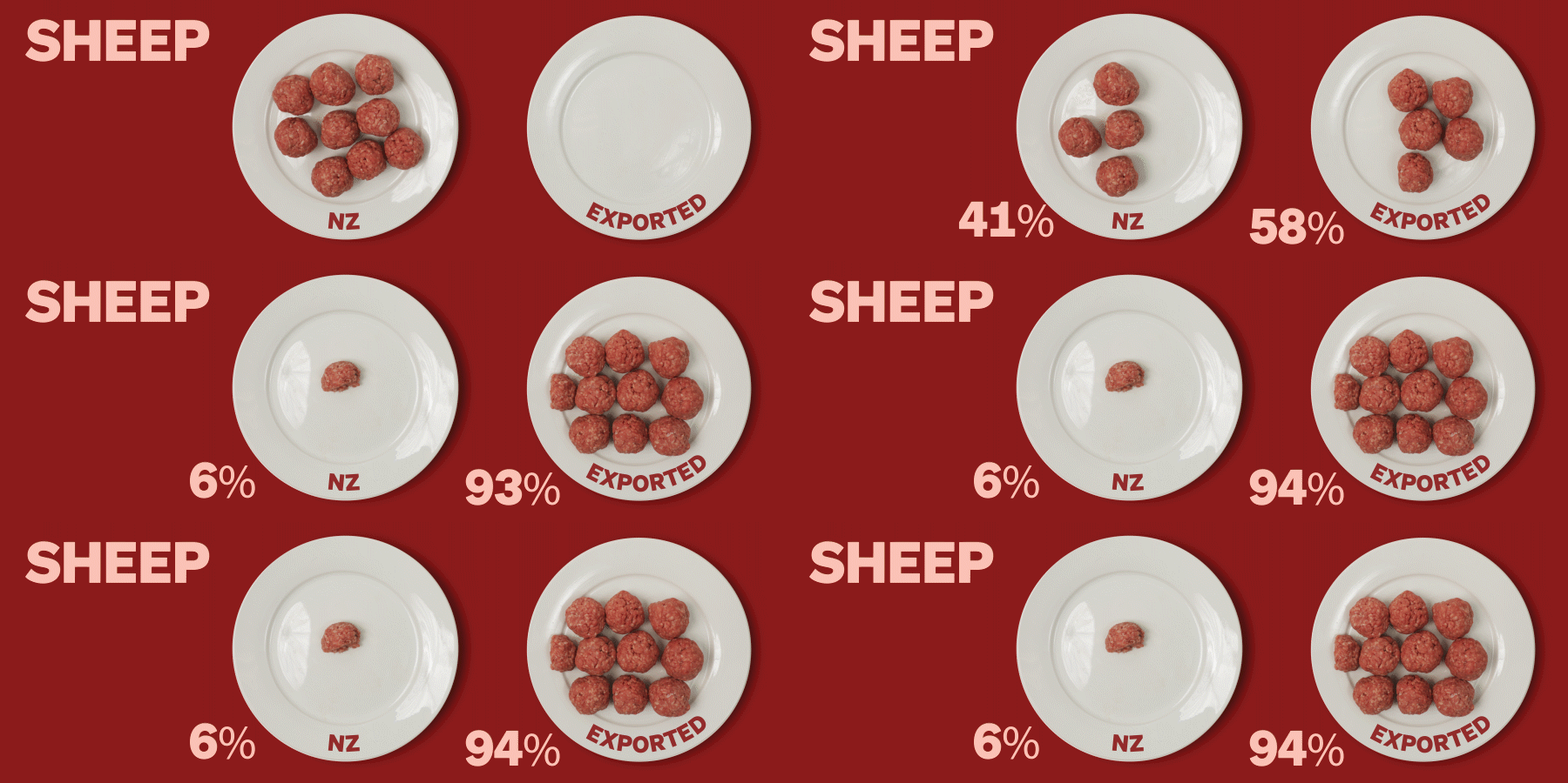
If you imagine New Zealand’s sheep meat as a plate of 10 meatballs, Kiwis would get to eat half of a meatball. So where’s the rest going? In the first story in a new series, Farah Hancock crunches more than 30 years of data to find out who’s eating New Zealand.
New Zealand produces enough food to feed about 40 million people but given our population is just 5 million, who are these people we’re feeding and what are they eating?
And in the land of milk and honey, how much is left behind for Kiwis?
RNZ has looked at some of our biggest merchandise export earners and some of our highest profile products to see who has been eating and drinking New Zealand over the past 30 years.
New Zealand exports a whopping 95 percent of the dairy it produces, which earned the country nearly $16 billion in 2020.
China has emerged as our biggest customer in recent years, its spending on dairy growing from $13.5m in 1990 to more than $5.5bn in 2020. China now accounts for about a third of our dairy exports.
Press the red play button on the chart below, or click on the years at the bottom of the chart, to see who’s been buying our dairy products since 1990.
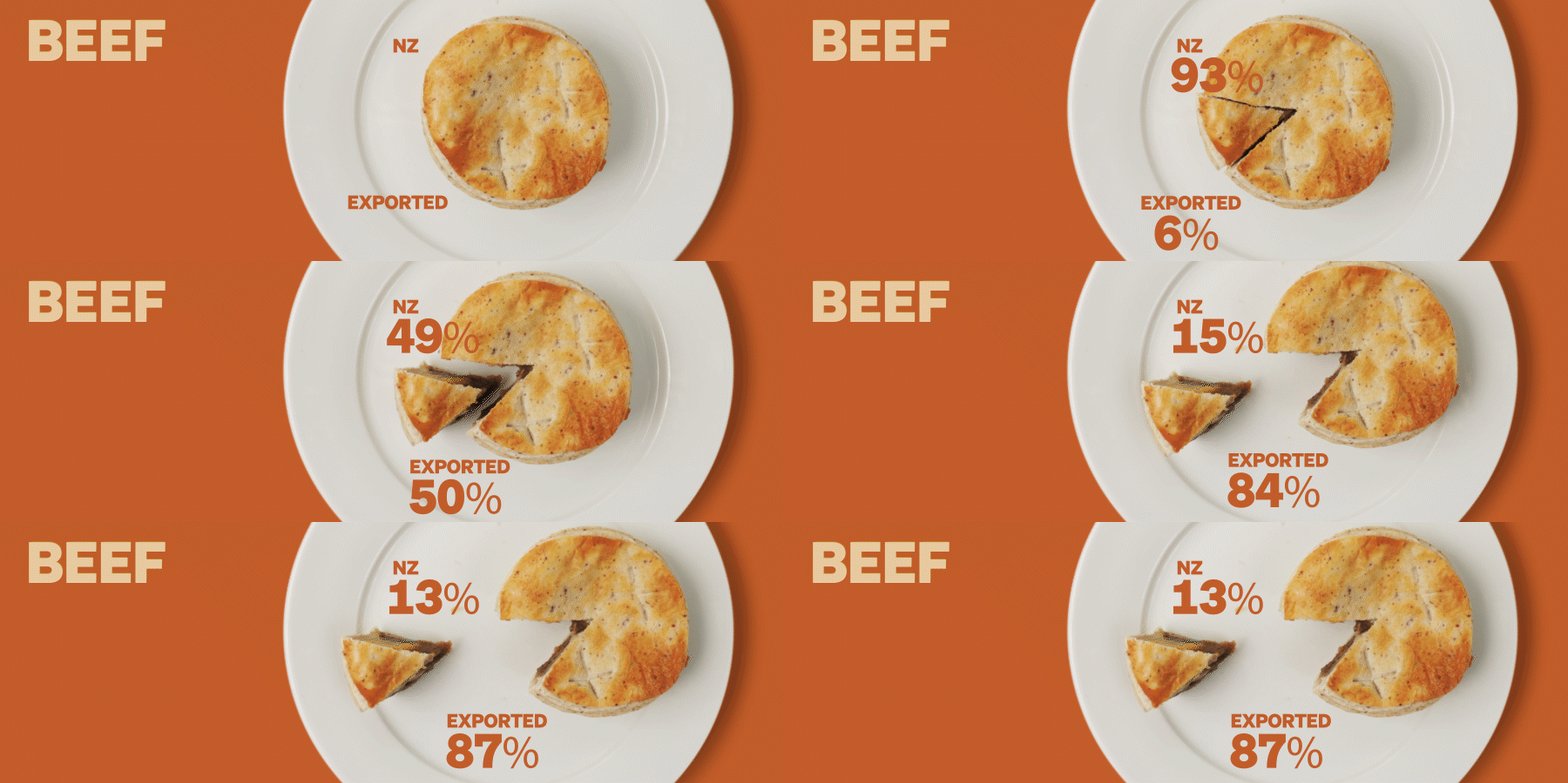
New Zealanders get to eat about 13 percent of the beef produced in New Zealand. The United States has been our biggest beef buyer since 2010. However, since 2012 China has entered the top 10 buyer ranking and in 2019 bumped the US out of the top spot, spending over $1.6bn on Kiwi beef. In 2020, the US regained the top spot.
If you imagine New Zealand’s sheep meat as a plate of 10 meatballs, Kiwi’s would get to eat half of a meatball.
In 1990 the United Kingdom was the biggest buyer of NZ sheep meat but for the past seven years China which has held the top spot, increasing its spending from $119m in 2010 to $1.6bn in 2020.
The United Kingdom spent $420m in 2020, down from $606m in 2010.
Green, gold and now red. Since 1996 we’ve exported 8.6bn kg of fresh kiwifruit and earned around $25.6bn. In 2020, exports were a record breaking $2.7bn.
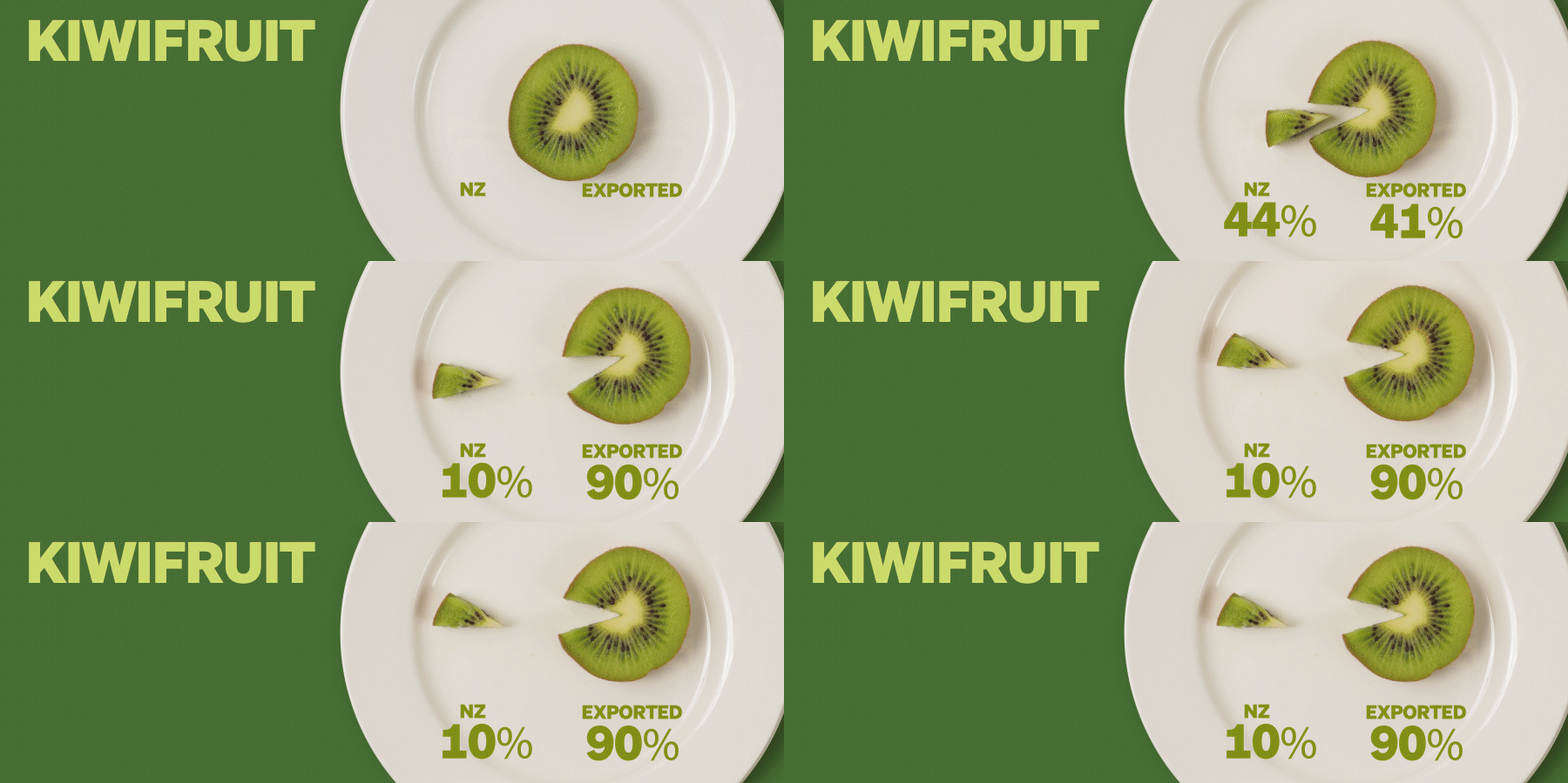
New Zealanders only get to eat around 10 percent of what’s grown here. Domestic sales are limited by regulation, says Zespri Chief Global Supply Officer Alastair Hulbert. In 2020 round 2m trays of green kiwifruit are sold domestically, as well as 800,000 trays of gold and 10,000 trays of the new, red variety.
The biggest international customers are Europe, Japan and China.
There’s no easy answer to what percentage of commercially caught seafood is exported and what percentage is eaten locally. The industry body, Seafood NZ, says there’s been no need to collect the information.
Previously published figures include 90 percent, 77 percent, and numbers on Seafood New Zealand’s website say approximately 450,000 tonnes of seafood is caught each year, with 276,901 tonnes exported. This comes out at around 63 percent – but working on caught weight versus exported weight isn’t accurate. Fish is gutted and often filleted before export, so it’s impossible to match the caught weight up with export data. Sealord, one of the large quota-owning companies, says it exports more than 90 percent of its catch. Sanford’s 2019 annual report says around 56.1 percent of its sales are export sales.
In the 1990s Japan, Australia and the United States were the biggest buyers of our seafood, but by 2011 China emerged as the top buyer. In 2019 China purchased almost $690m worth of seafood, while the second biggest buyer was the United States, spending $245m.
Earnings from seafood have largely risen, with a small fall in 2020, while the weight exported has decreased from nearly 300m kg in 2005 to 231m kg in 2020.
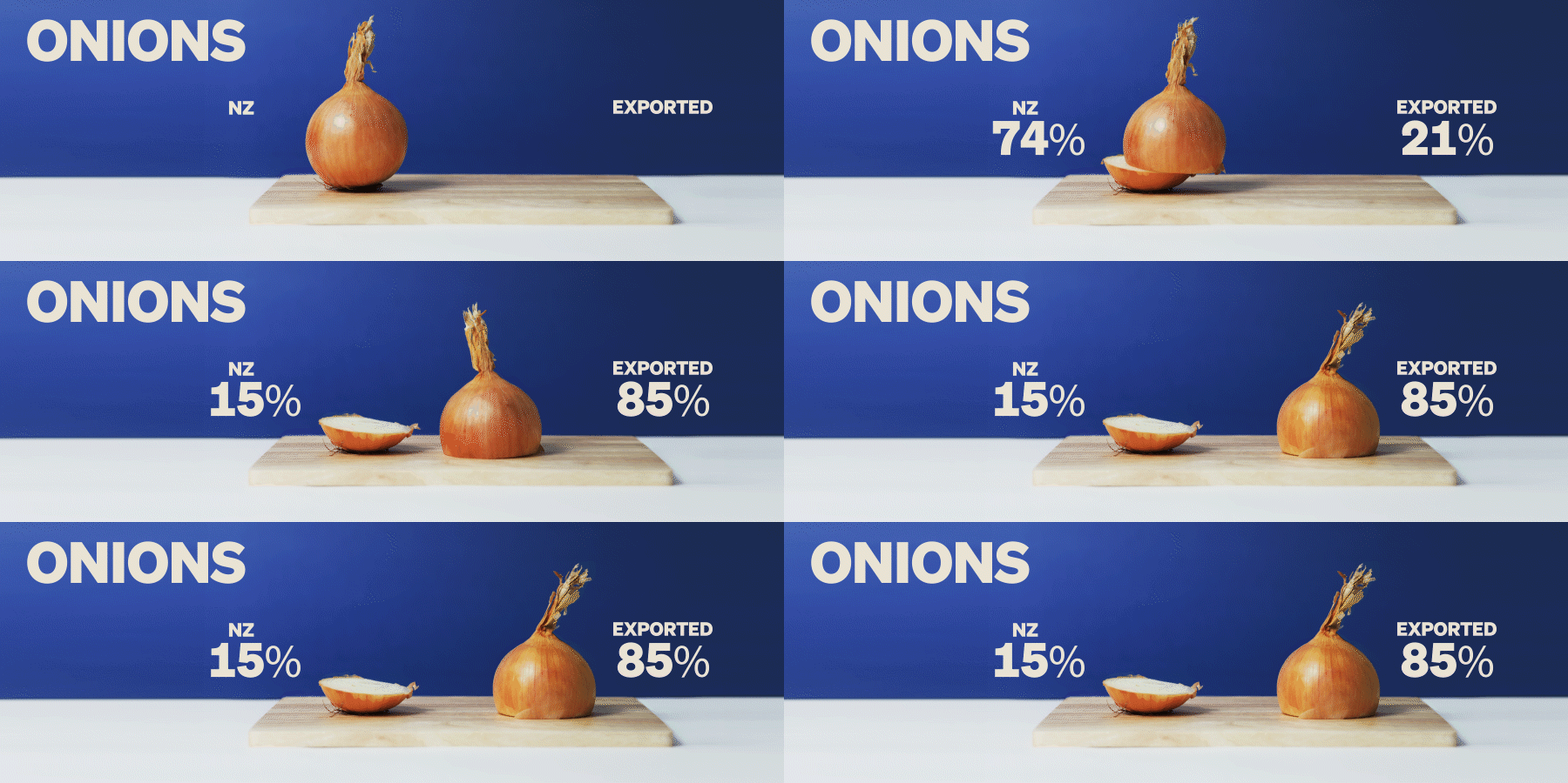
Our humble onions are hot property abroad, in fact by value they’ve been New Zealand’s top export vegetable crop since 2012. We send around 85 percent of them offshore, leaving just 15 percent to be eaten in Aotearoa. In 2020, New Zealand exported more than 200,000 tonnes, earning $154m.
Their long-shelf life makes them ideal as an export product and as we harvest at the opposite time of year to northern hemisphere growers, our onions fill a gap in global production.
Indonesia and Malaysia are big onion buyers, along with Germany and the Netherlands.
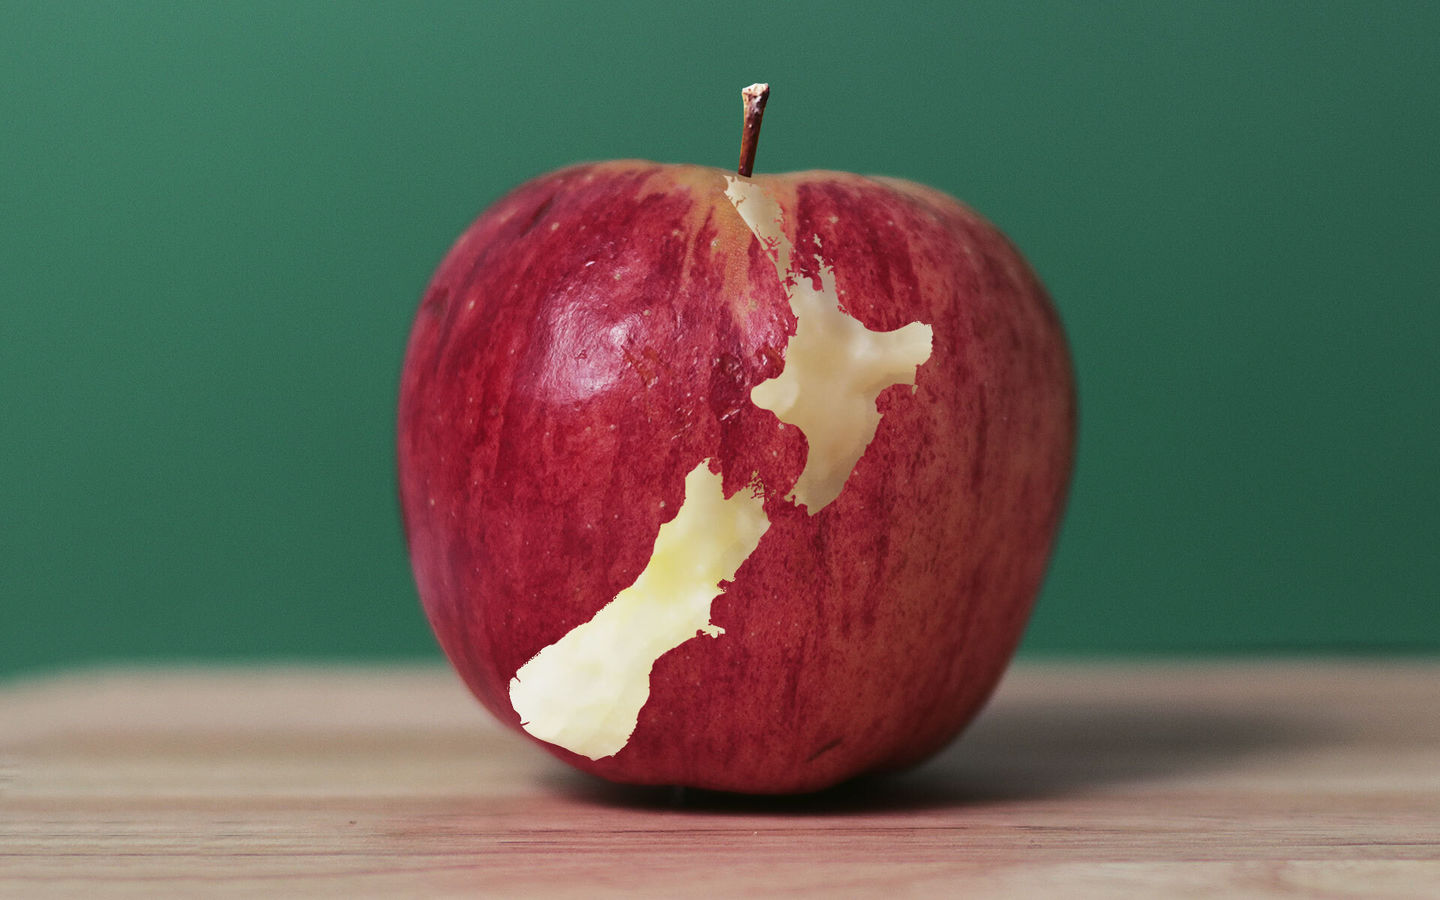
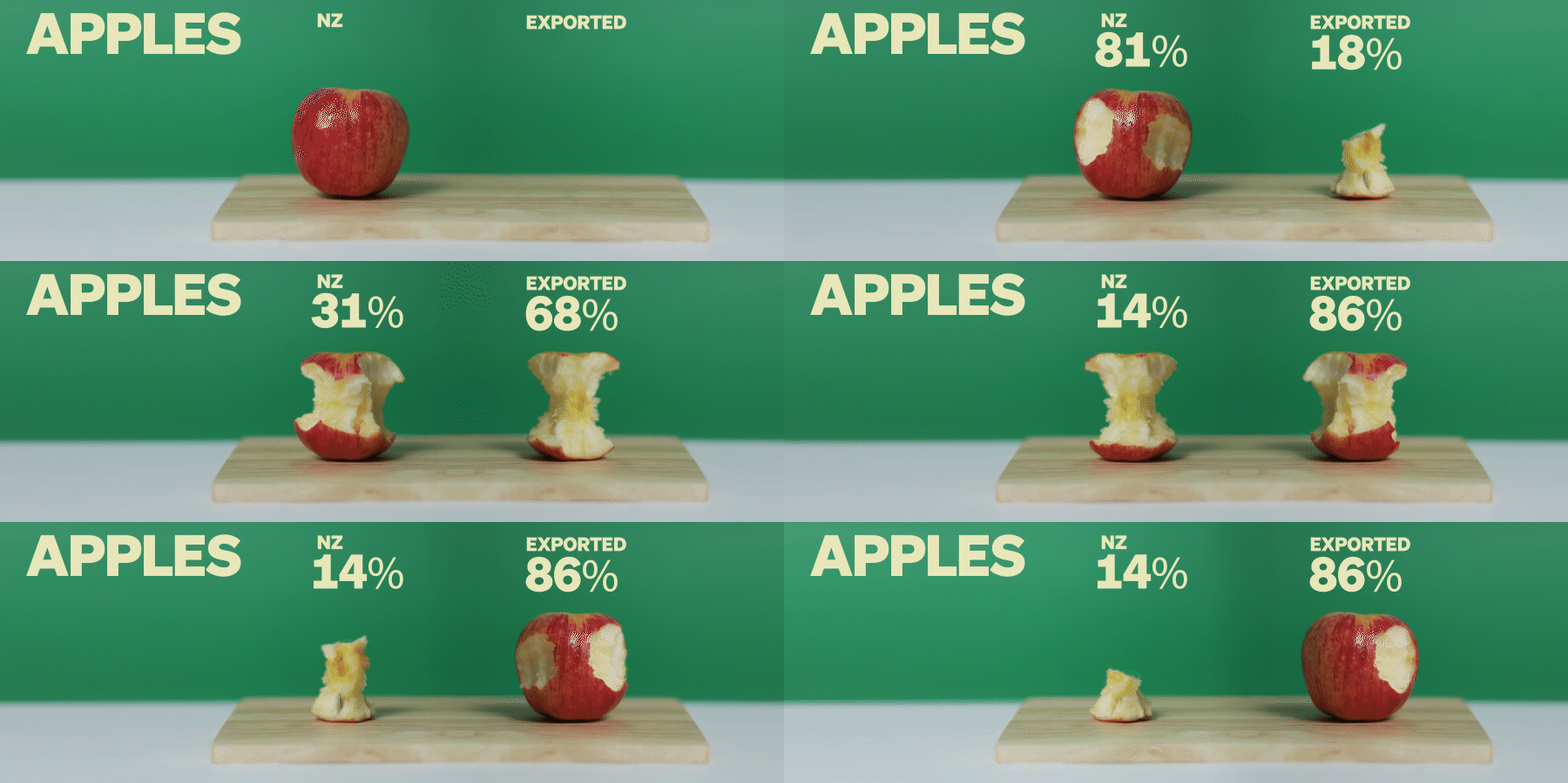
Around 86 percent of apples grown in New Zealand are sold overseas. In 2020 they earned a record $910m, tantalising close to the industry’s goal for 2022 of $1bn. The goal was set in 2012, when exports were sitting at $340m.
China was our biggest apple buyer in 2020, followed by Vietnam and Taiwan. The United States and United Kingdom slipped into fourth and fifth spots.
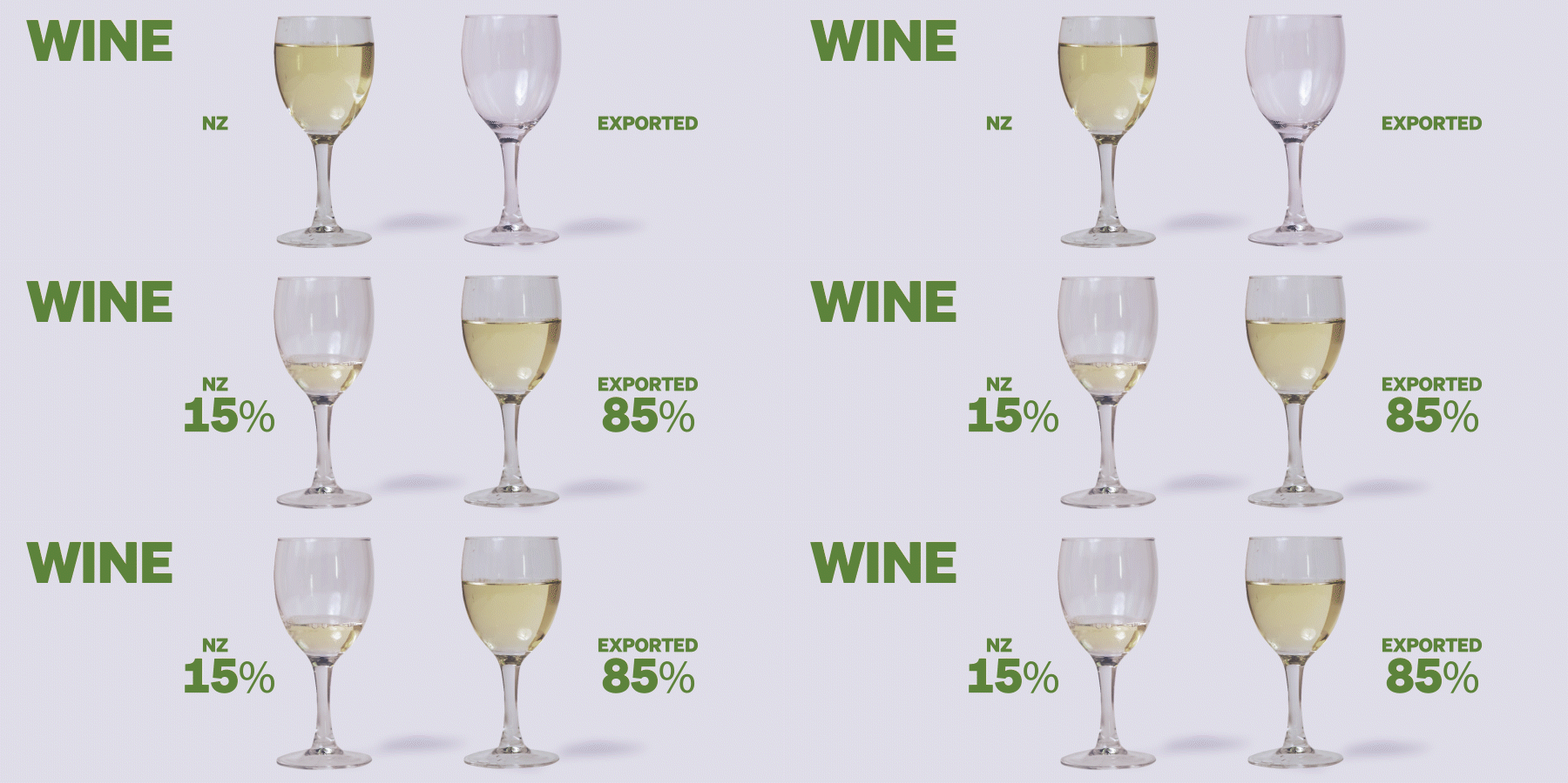
Lockdown tipples may have been behind the record-breaking $2bn worth of New Zealand wine sold to the world in 2020. Of the wine we produce, 85 percent is drunk offshore.
Wine is one of the few New Zealand exports that isn’t dominated by Chinese buyers. We mainly produce sauvignon blanc, which sells well in the United States, the United Kingdom and Australia.
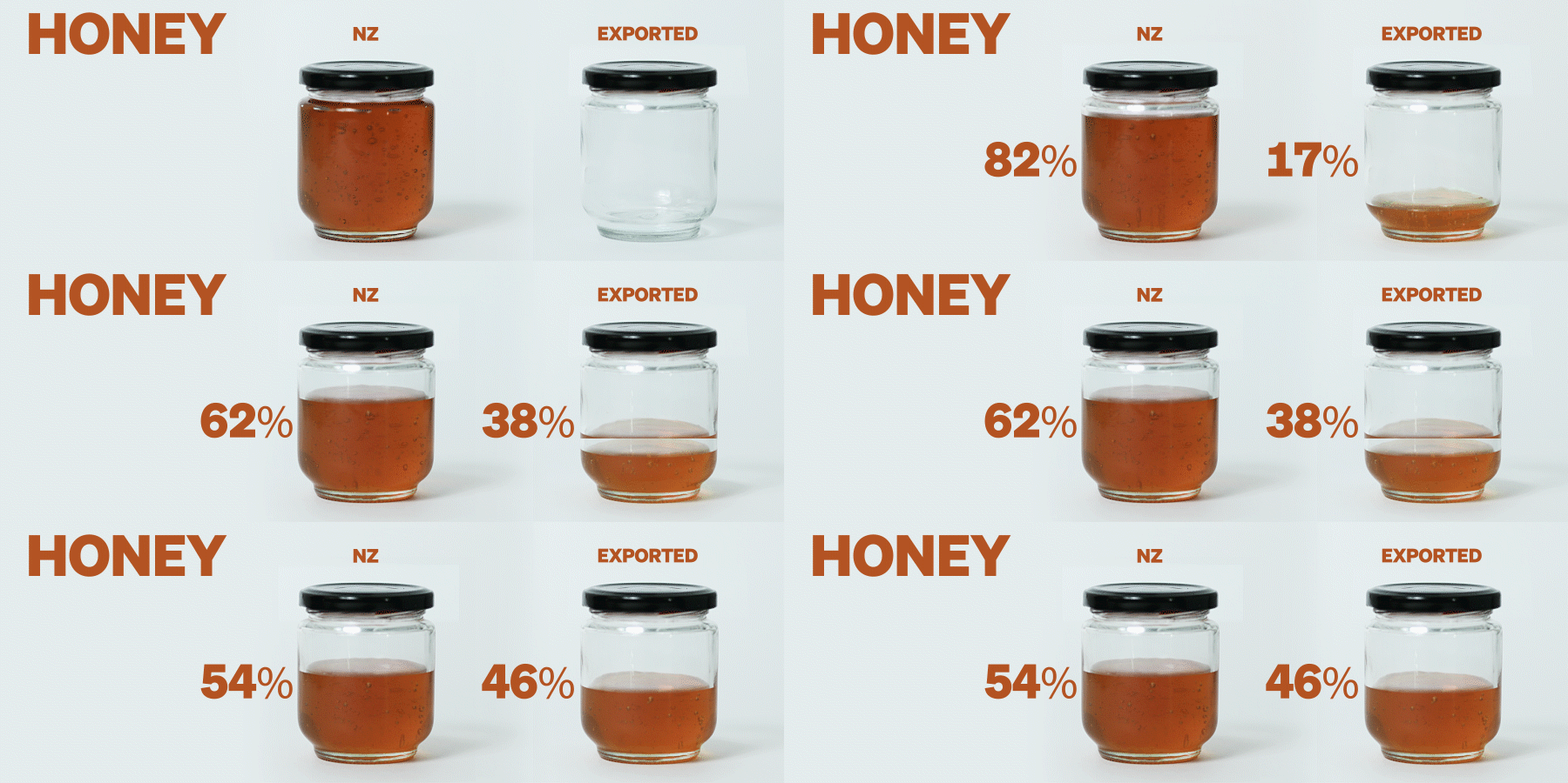
With news stories about mānuka honey selling for nearly $3000 a jar in London, you might think New Zealand would be exporting a huge proportion of our honey. In fact, in 2019 we exported less than half what we produced. Adding in honey purchased by tourists visiting our shores in 2019, around 46 percent of honey ended up offshore. Without tourists this figure would have been 38 percent.
China is our biggest buyer, followed by the USA and Japan.
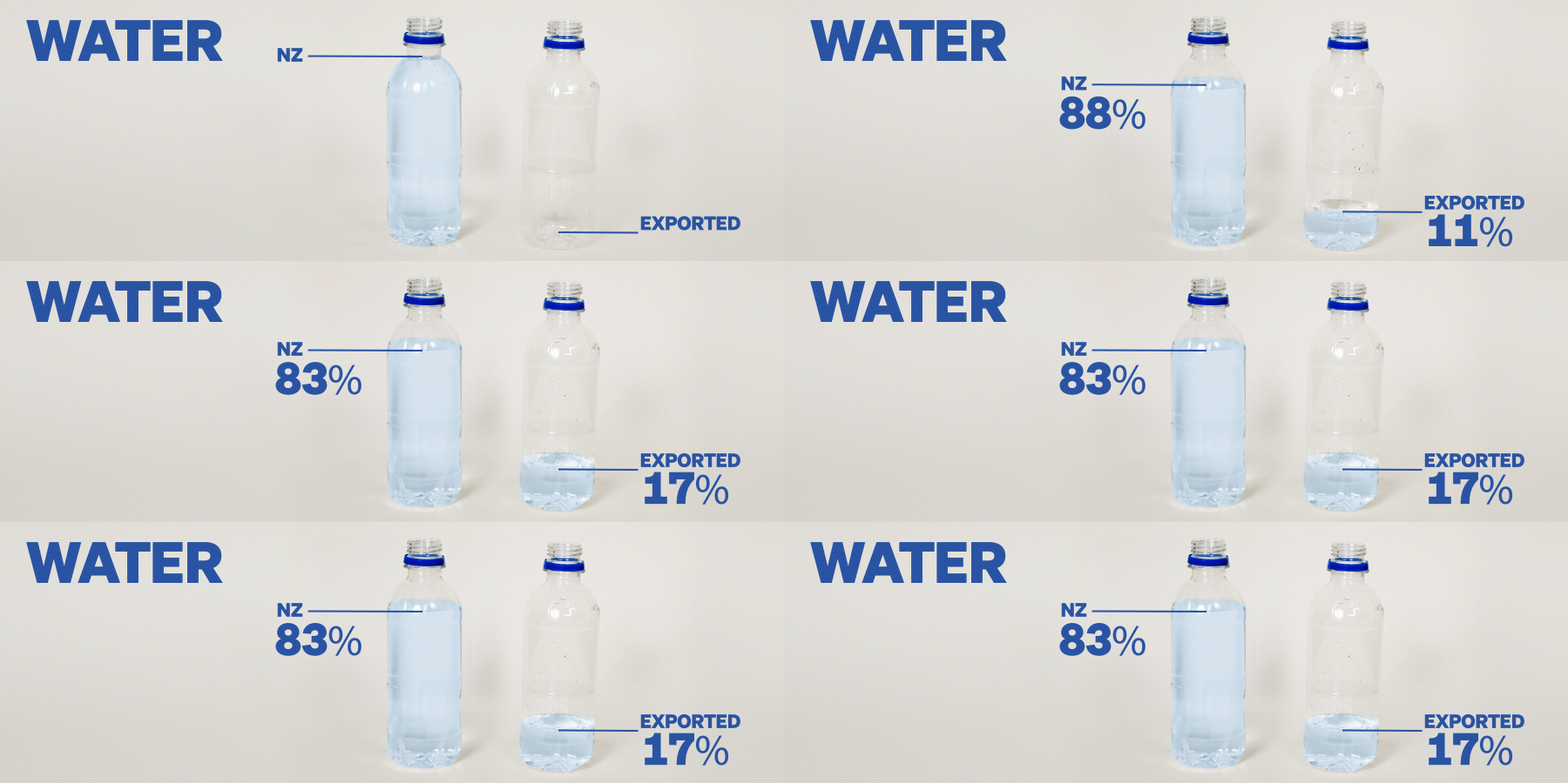
Despite high-profile controversy about global beverage giants bottling our water, exported New Zealand water actually represents a small proportion compared to what’s sold locally.
An exact figure for local sales is hard to come by, but 2018 information published on the Ministry for the Environment’s website suggests only 17 percent is exported.
In recent years China has emerged as the top buyer of our water; previously the US and Australia were the biggest purchasers.
Dairy outstrips all our other food and beverage exports. Since 1990 it’s earned $231bn. Sheep meat comes in second with $71bn, with beef third at $59bn.
Between the 1870s and 1940s, the UK was our main export market, taking between 60-90 percent of our exports. This began to wane and by the time the UK joined the European Economic Community (now the European Union) in 1973, it was taking less than 30 percent of our goods.
Since China and New Zealand signed a free trade agreement in 2008, China’s contribution to our export earnings has significantly increased. In 2007 China accounted for 5 percent of our earnings from dairy produce. Now 35 percent comes from China. For sheep, there’s been a jump from 3 to 42 percent, and for beef it’s gone from 0.09 to 33 percent.
Photography by Claire Eastham-Farrelly. Visuals by Vinay Ranchhod.
Where the data came from
Dairy: Dairy Companies Association of New Zealand and StatsNZ trade data items with a harmonised system description containing “Dairy produce”
Beef: Beef + Lamb New Zealand from September 2019 to September 2020 and StatsNZ trade data for items with a harmonised system code between 201100000 to 202331999.
Sheep: Beef + Lamb New Zealand from September 2019 to September 2020 and StatsNZ trade data for items with a harmonised system code between 204100000 to 204431000.
Kiwifruit: Zespri International 2019 data and StatsNZ trade data items with a harmonised system description containing “Fruit, edible; kiwifruit”
Seafood: Various sources and StatsNZ trade data for items with a harmonised system code between 301910000 to 308909000.
Onions: Onions New Zealand Inc and StatsNZ trade data items with a harmonised system description containing “Vegetables, alliaceous; onions”.
Apples: New Zealand Apple and Pears and StatsNZ trade data items with a harmonised system description containing “Fruit, edible; apples”.
Wine: NZ Wine and StatsNZ trade data items with a harmonised system description containing “Wine”.
Honey: Apiculture NZ and StatsNZ trade data items with a harmonised system description containing “Honey”.
Water: Ministry for the Environment and StatsNZ trade data items with the following harmonised system descriptions: “Waters; mineral and aerated, including natural or artificial, (not containing added sugar or other sweetening matter nor flavoured), other than in metal containers”, Waters; other than mineral and aerated, (not containing added sugar or other sweetening matter nor flavoured), ice and snow, other than in metal containers” , “Waters; mineral and aerated, including natural or artificial, (not containing added sugar or other sweetening matter nor flavoured), in metal containers”, “Waters; other than mineral and aerated, (not containing added sugar or other sweetening matter nor flavoured), ice and snow, in metal aerosol containers, not containing chlorofluorocarbons” , “Waters; other than mineral and aerated, (not containing added sugar or other sweetening matter nor flavoured), ice and snow, in metal containers, not aerosol”
